Are you familiar with statistics? Then, you might have heard a term named “Z-Score”. In statistics, this term refers to the number of standard deviations, which will be above or below a data point. Excel allows you to calculate Z-Score, and the process is very simple. You should know that the requirements for Z-Score are a data point, mean value, and standard deviation value. As the formula contains these arguments, you are unable to calculate the Z-Score without them. In order to make these things easier for you, we will discuss in this article how to calculate Z Score in Excel.
What Is A Z Score?
A z-score is also known as a standard score. It helps you to understand the distance between the value of a mean and a data point. However, technically, it refers to the number of standard deviations below or above the population mean of a raw score. In other words, you can say that it lets you understand how unusual a particular data point is relative to the remainder of the data set.
Why Is It Important?
It is important for several reasons, including:
- With the help of this, you are able to compare data sets with different means & standard deviations. You are capable of identifying outliers or extreme data points which could skew your results. Also, these help to calculate confidence intervals & other statistical measures.
- You can use z-score to standardize data from different sources. It is another reason why it is important. For instance, you want to compare the performance of two different groups on a test, but the scores of these two tests were different. If this is the case, you are able to use these Z scores in order to standardize the scores & make them comparable. It is beneficial in various fields, such as education & psychology, where Researchers often have to compare data from different sources or studies.
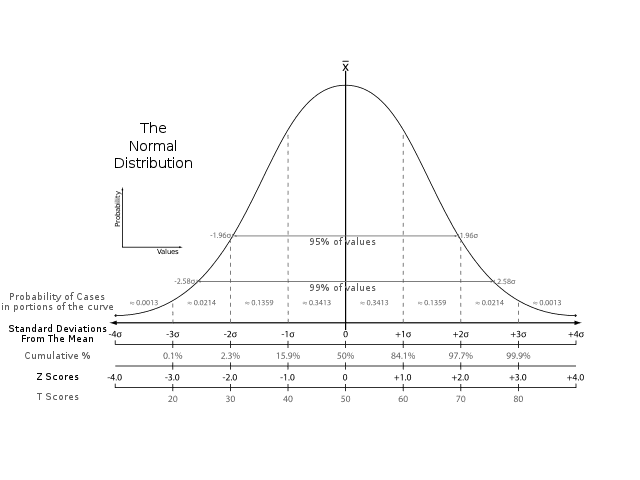
About The Normal Distribution Curve:
Before knowing how to calculate these scores, you should first understand the normal distribution curve, which represents a set of data with a normal or bell-shaped distribution. The position of the normal distribution curve is in the center around the mean, and most data fall within one or two standard deviations from the mean.
In order to have a visualization, you can take a graph where the X-axis represents the values in your data set. The Y-axis shows the frequency used to make the value. This type of curve can be a bell-shaped curve positioning center on the mean.
You must know that this curve is a theoretical concept. All data sets won’t fit the curve perfectly. Multiple real-world data sets prefer to exhibit a pattern following a normal distribution. As a result, it becomes a useful tool for modelling & statistical analysis.
Z-score Formula – Standard Error Of The Mean:
If you have many samples and are willing to describe the standard deviation of them, you need to use the Z-Score formula, that is:
z = (x – μ) / (σ / √n)
This score will inform you of the number of standard errors between the sample mean & the population mean.
Example Problem:
Suppose women’s mean height is 65″ where 3.5″ is the standard deviation. Then, what could be the probability of finding a random sample of 50 women where 70″ is the mean height? ( Hence, you need to assume that the heights are normally distributed).
z = (x – μ) / (σ / √n)
= (70 – 65) / (3.5/√50) = 5 / 0.495 = 10.1
In this case, it is a sampling distribution of means. Therefore, it is necessary to add the standard error in the formula. In a normal probability distribution, 99% of values fall within three standard deviations from the mean. As a result, you can see that the probability of the sample of women with a 70″ mean height is less than 1%.
Using the Standard Deviation Function in Excel:
Now, you know about the basics of the normal distribution curve.
Once you understand this, you can begin to calculate Z scores in Excel.
In order to calculate it, your job is to use the standard deviation function built into Excel.
The function you need to use is =STDEV.S in order to compute the standard deviation of some data points. Suppose your data is in cells A1 through A10. If this is the case, you are able to use the formula =STDEV.S(A1:A10) to compute the standard deviation of such data points.
Keep in mind that in Excel, the standard deviation function comes with two versions: STDEV.S and STDEV.P. If your data set represents a sample of a larger population, you need to use the STDEV.S function. You can use the STDEV.P function if you have the entire population data set. It is essential to use the correct function for the data set in order to ensure accurate calculations.
You should follow these steps in order to find the standard deviation.
- Your first task is to navigate to the Formulas tab. Then, you need to tap on More Functions, which you can see under the Function Library section.
- In the next step, your task is to tap on the Statistical Function category from the drop-down list to open a list which contains the names of all functions. Then, you have to tap on STDEVPA from the list.
- You can now see a Function Arguments dialog box. Hence, your job is to put the cells range from B4:B13 under field Value1. Then, you have to tap on OK.
Thus, you can get the standard deviation value.
How to Find The Mean Of A Data Set In Excel:
If you are willing to compute Z scores, your task is to understand the mean of your data set. And your job can be easier with the =AVERAGE function because of Excel. You only have to choose the range of cells which contain your data. Then, you need to put the formula =AVERAGE(range).
You need to know that the mean refers to a measure of central tendency, and it will not always be the most appropriate measure to use. The mode or median can be more appropriate, but it depends on your data distribution. Examining your data distribution is good before you decide the measure of central tendency that you will use.
If you are willing to find the average, you have to follow the below-mentioned steps:
- First, you should move to the Formulas tab. After that, your task is to tap on the More Functions options under the Functions Library section.
- Once you see the drop-down list, you need to tap on the Statistical Functions category. A list of functions will appear. Then, you need to tap on the AVERAGE function.
- You can now see a Function Arguments dialog box. Then, you have to enter the range from Cells B4:B13 under field Number1. Next, you have to tap on OK.
Thus, you can get the Average or Mean value.
How to Calculate The Z Score For A Single Data Point:
Your data set’s mean and standard deviations are available now. Therefore, you are able to calculate the Z scores. In order to calculate the Z score for a data point, the formula you need to use is:
Z = (X – μ) / σ
Where the arguments are:
- Z = Z score value.
- X = It represents the value which should be standardized.
- µ = It represents the Mean of the given set of data values.
- σ = It represents the Standard deviation of the given set of data values.
Suppose the mean of your data set is 50, whereas 10 is its standard deviation. If you are willing to compute the Z-Score for a data point of 65, the result you will get using the formula will be:
Z = (65 – 50) / 10 = 1.5
It means that the data point of 65 is one & a half standard deviations above the mean.
You need to know that you can use the Z scores to compare data points from separate data sets. It is important to standardize the data using Z scores in order to compare data points with different units or scales. It is beneficial in fields like finance, where you might need to compare the performance of various stocks of separate values.
In order to calculate the Z score, you will require a data set to get the mean and standard deviation for the first most variable.
The syntax used for calculating the mean of any given range is: =AVERAGE(range)
In the same way, the syntax used for calculating the Standard deviation is: =STDEVPA(range)
How to Calculate Z Score In Excel:
Calculate The Z Score For Multiple Data Points:
You might not take an interest in only one data point. However, Excel has made calculating the z-score easy for multiple data points at once.
In order to calculate it, you have to create a column for your Z scores. And it is possible when you choose a cell adjacent to your data set. Then, you need to enter the formula =STANDARDIZE(X,μ,σ). Hence, X represents the cell where your preferred data point exists. μ indicates the mean of your data set. Whereas, σ represents your dataset’s standard deviation.
Then, you can calculate the Z score for every data point in your set by copying the formula down the entire column.
When you calculate scores for many data points, you have to make sure that both standard deviation & mean are constant references to the cells where their value for the whole dataset is calculated. It makes sure that Z scores are accurate & comparable across all data points.
Let’s look at these steps to learn how to calculate Z score in Excel.
- First, you need to head toward the FORMULAS tab. Then, you need to tap on the More Functions option under the Function Library section.
- You can see a drop-down list which contains the names of the functions. Then, you have to tap on Statistical functions from the list. Now, a list of functions will appear. You should tap on the STANDARDIZE function from the list thereafter.
- Next, you can see a Function Arguments dialog box. You need to put the Cell value B4 under field X.
- After that, your job is to put the Mean value in the second field, mentioned as Mean under Cell B15.
- In the 3rd field, Standard_dev, you have to put the Standard Deviation value under Cell B16. Then, your job is to tap on OK.
- Now, you will get the result.
- You are required to drag the formula you used to get the remaining values. It pops up the Z score values in Excel.
How to Calculate Z Score In Excel Using Conventional Formula:
First, you need to know about the conventional formula through which you are capable of calculating the Z-score in Excel. In order to apply the procedure, your job is to calculate your data set’s mean value. Next, your job is to calculate the standard deviation. Once you calculate these two values, you are able to calculate the Z-score in Excel. These are the steps you should follow:
Step 1— Calculate Mean Of Dataset:
Calculating the dataset’s mean value is the very first step you need to do. The AVERAGE function can be used to calculate the mean value of your data set.
- First, your task is to choose cell G4.
- After that, your job is to write the given formula in the formula box:
=AVERAGE(C5:C12)
- Then, you need to apply the formula by pressing Enter.
Step 2— Calculate Standard Deviation Of Dataset:
In this section, your task is to calculate the standard deviation. You can define the standard deviation as how scattered the data is in relation to the average value. So, to get the value of the standard deviation of your data set, you can use the STDEVPA function. It allows you to calculate the value properly.
- Your first job is to choose cell G5.
- After that, your task is to write the formula given in the formula box.
=STDEVPA(C5:C12)
- Then, you have to apply this by pressing Enter.
Step 3— Calculate Z Score:
Hence, you have to focus on calculating the Z-Score. To do so, you will need the value of the mean & standard deviation, which we have done already in the above two sections.
- First, your task is to choose cell D5.
- Then, you have to write down the formula in the formula box.
=(C5-$G$4)/$G$5
- In this case, you need to know that cell G4 represents the mean of your data set, whereas cell G5 refers to the standard deviation. You can use the ($) sign to make the calls absolute, which indicates that it is fixed.
- Then, you have to apply the formula by tapping on Enter.
- You are able to apply the formula down the column by dragging the Fill handle icon up to cell D12.
Use Z Scores To Compare Two Data Sets:
You can use these scores to compare two data sets with different means & standard deviations. In order to compare two data sets, for each data point in these two data sets, your job is to calculate the Z score. After that, you have to compare the resulting Z scores.
Suppose there are two data sets. One set contains 50 mean values and ten standard deviation values. On the other hand, 75 is the mean of another data set, whereas the standard deviation is 5. If you are willing to compare them both, you need to use the formulas mentioned before to calculate the Z score for every data point in both sets.
As soon as you get the scores for these two data sets, you are able to compare them to see the set that has more unusual data points. It is beneficial in multiple research studies & statistical analyses.
Keep in mind that these two data sets have to measure the same variable or concept when you compare them using the Z scores. For instance, you might not be willing to compare the Z scores of a data set that measures income to a data set measuring height. It might result in wrong or misleading endings.
In addition, you have to consider the comparison’s purpose & context. It isn’t mandatory that a data set with more Z scores will be better than one with less extreme Z scores. The interpretation of the comparison relies on the specific research question or hypothesis being tested.
How To Interpret Z Scores:
After knowing the procedure of calculating Z scores, you need to understand what these tell you about your data. It will be more extreme or unusual when the data point is far from the mean in terms of standard deviations.
In order to calculate confidence intervals, you need to use the Z scores. It informs the range of values within which it can be expected that a specific percentage of data can fall. For instance, if a confidence interval is 95%, it means we’re 95% confident that a certain data point will fall within a certain value range.
Remember that the Z score may be positive or negative, or the score can be equal to zero.
A positive Z-score denotes a specific value greater than the mean. A negative z-score means that a certain value is less than the mean. If the z-score is zero, a certain value is equal to the mean.
Applying Z Scores In Statistical Analysis And Research Studies:
You can apply these scores in different statistical analyses and research studies. For instance, these are mainly used in finance. These help you understand stock prices & other market data. Besides, these are beneficial in medical research where they help in identifying potential risk factors for specific diseases or conditions.
Common Errors To Avoid When Calculating Z Scores In Excel:
It is simple to calculate Z scores in Excel. However, some common errors are there to look out for.
- Ensure that you are using the correct formula and formatting your cells correctly.
- You need to double-check your data to make sure that you use the correct mean & standard deviation.
- Remember that you can use Z scores only to analyze distributed data. If data does not follow a normal distribution curve, then the Z scores will not be a correct measurement tool.
Alternative Processes For Calculating Z Scores In Excel:
The formulas mentioned earlier are the easiest ways to calculate the Z-Score in Excel. However, some alternative ways are there that you can consider to calculate the Z scores in Excel. For instance, using the =NORM.S.INV function is possible in order to calculate the inverse of a standard normal distribution value.
Tips And Tricks For Working With Large Data Sets In Excel:
Are you working with a large data set? Then, some tips & tricks can be used to simplify the process of calculating Z scores. For instance, you can use the data analysis tool of Excel. With the help of the tool, you are able to automate the calculation of statistics & other measures. Using Excel’s fill handle is also possible in order to copy formulas & data down a column. Thus, you can save both effort & time.
Real-World Applications of Z Scores In Business, Science, And Finance:
Z scores have a wide range of real-world applications in these three sections: business, science, & finance. For instance, you can use them in finance in order to understand stock prices & other market data. Besides, these help to identify potential risk factors for some specific diseases in medical research.
The Bottom Line:
Although calculating Z scores may seem difficult at first, you should know that it is an important tool for those who are interested in statistics or data analysis. We hope that after going through this article, you have understood how to calculate Z scores for your data sets using Excel’s default tools and the formulas. Keep in mind that you need to double-check your data and look for common errors. For further queries or confusion, do ask us via comments.
Frequently Asked Questions
How do you calculate the z-score?
You need to use this formula to calculate a z-score:
z = (x-μ)/σ,
Where x denotes the raw score, μ represents the population mean, and σ indicates the population standard deviation.
How do you calculate the Z test in Excel?
=Z.TEST(array,x,[sigma]) is the function you should use to calculate the Z test in Excel.
What is Z value Excel?
Z represents the value because of which you want the distribution.